Kursindex • Aktienindex
STOXX Europe 600 Utilities
- WKN
- 965896965896
- ISIN
- EU0009658962EU0009658962
- Land
- Europa
- Familie
- Dow Jones Stoxx
- Sektor
- Versorger
- Ticker
- SX6PSX6P
• STOXX
438,63 Pkt.
+3,62 Pkt.+0,83 %
Top/Flop-Verteilung (31 insgesamt)
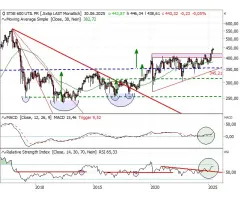
Kursentwicklung
Handelsdaten
Tagesspanne
433,51 – 438,71 Pkt.
52W-Spanne
367,30 – 439,14 Pkt.
Vortag
435,01 Pkt.
Eröffnung
433,85 Pkt.
Passende Produkte auf STOXX Europe 600 Utilities
Werbung von
Filterauswahl
Gewinner und Verlierer im STOXX Europe 600 Utilities
Top-Aktien im STOXX Europe 600 Utilities
Wert | akt. Kurs | Perf. | Intraday | Einstellungen |
---|---|---|---|---|
Elia Group WKN A0ERSV | 93,600 EUR | +3,03 % | ||
VERBUND WKN 877738 | 67,700 EUR | +2,97 % | ||
EDP - Energias de Portugal WKN 906980 | 3,448 EUR | +2,34 % | ||
Uniper WKN UNSE02 | 41,350 EUR | +1,97 % | ||
Enagás WKN 662211 | 13,770 EUR | +1,70 % |
Flop-Aktien im STOXX Europe 600 Utilities
Wert | akt. Kurs | Perf. | Intraday | Einstellungen |
---|---|---|---|---|
Red Eléctrica WKN A2ANA3 | 18,500 EUR | -3,65 % | ||
Naturgy Energy Group WKN 853598 | 26,240 EUR | -0,23 % |
STOXX Europe 600 Utilities im Vergleich
Wert | akt. Kurs | Perf. akt. Perf. 1 Jahr | 1 Jahr |
---|---|---|---|
22.548,79 Pkt. UBS Indikation · | +0,28 % +24,42 % | ||
5.160,22 Pkt. STOXX · | -0,03 % +4,86 % | ||
5.524,73 Pkt. UBS Indikation · | -0,64 % +7,97 % | ||
19.422,34 Pkt. UBS Indikation · | -0,64 % +9,19 % | ||
13.065,24 Pkt. FTSE · | -0,61 % +4,41 % | ||
35.866,57 Pkt. NIKKEI · | +0,07 % -6,61 % | ||
546,44 % FTSE · | -0,36 % +8,38 % | ||
378,33 Pkt. S&P INDICES · | -0,40 % +6,49 % | ||
131,890 EUR Eurex · | +0,38 % +0,79 % | ||
518,11 Pkt. S&P INDICES · | -1,88 % -12,56 % | ||
1,1346 USD FactSet Forex Rates · | -0,39 % +5,89 % |
News zu STOXX Europe 600 Utilities
STOXX Europe 600 Utilities - Der ultimative Deckel?
Werbung
· Uhr · HSBC STOXX® Europe 600 Utilities - Das Comeback des Jahres?
Werbung
· Uhr · HSBCAnlagethemen
Performance-Kennzahlen STOXX Europe 600 Utilities
Einstellungen | 1 Monat | 3 Monate | 1 Jahr | 3 Jahre | 5 Jahre | 10 Jahre |
---|---|---|---|---|---|---|
Performance | +3,46 % | +13,83 % | +15,79 % | +9,29 % | +35,96 % | +31,39 % |
Volatilität | 36,22 % | 22,57 % | 16,56 % | 16,11 % | 16,85 % | 18,02 % |
Hoch | 439,14 Pkt. | 439,14 Pkt. | 439,14 Pkt. | 439,14 Pkt. | 439,14 Pkt. | 439,14 Pkt. |
Tief | 388,73 Pkt. | 378,48 Pkt. | 367,30 Pkt. | 304,20 Pkt. | 302,89 Pkt. | 253,87 Pkt. |