Kursentwicklung
Handelsdaten
Tagesspanne
826,24 – 826,24 Pkt.
52W-Spanne
675,50 – 840,95 Pkt.
Vortag
825,77 Pkt.
Eröffnung
826,24 Pkt.
Gewinner und Verlierer im CDAX Kursindex
Top-Aktien im CDAX Kursindex
| Wert | akt. Kurs | Perf. | Intraday | Einstellungen |
|---|---|---|---|---|
MING LE SPORTS AG WKN A2LQ72 | 0,120 EUR | +1.100,00 % | ||
DF Deutsche Forfait WKN A2AA20 | 2,160 EUR | +28,57 % | ||
NAKIKI WKN WNDL30 | 0,429 EUR | +23,63 % | ||
Ludwig Beck WKN 519990 | 17,90 EUR | +11,18 % | ||
DEMIRE Deutsche Mittelstand Real Estate WKN A0XFSF | 0,500 EUR | +10,62 % |
Flop-Aktien im CDAX Kursindex
| Wert | akt. Kurs | Perf. | Intraday | Einstellungen |
|---|---|---|---|---|
Paion WKN A3E5EG | 0,062 EUR | -48,33 % | ||
TC Unterhaltungselektr. WKN 745420 | 0,103 EUR | -26,43 % | ||
BayWa (vinkuliert) WKN 519406 | 3,025 EUR | -14,67 % | ||
SIMONA WKN A3E5CP | 47,00 EUR | -12,96 % | ||
Zalando WKN ZAL111 | 21,48 EUR | -12,08 % |
CDAX Kursindex im Vergleich
News zu CDAX Kursindex
CDAX® - Ein zweischneidiges Schwert
gnubreW
· Uhr · HSBC
CDAX® - Schlüsselhaltezone bestätigt
gnubreW
· Uhr · HSBC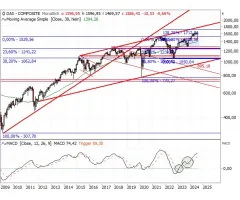
CDAX® - DAX® erstmals über 18.400 Punkten …
gnubreW
· Uhr · HSBC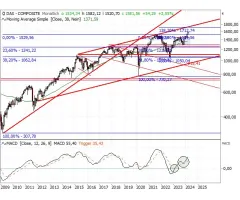
CDAX® - Kernunterstützung genutzt!
gnubreW
· Uhr · HSBC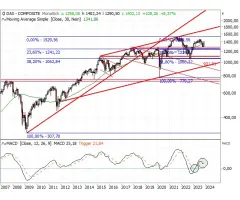
Technische Analysen
Werbung
Anlagethemen
Aktuelle Videos: Livestreams und Analysen
Märkte heute
Disney im Zahlencheck – Uber mit Altlasten, Palantir hebt Prognosen · Uhr · onvista
Rüstungsspezialisten
Ondas und Red Cat: Zwei Drohnen-Wachstumsstars im Check · Uhr · onvista
Der große onvista-Halbjahresausblick
Aktien, Silber, Bitcoin: Meine Kursziele bis Jahresende · Uhr · onvista