Kursentwicklung
Handelsdaten
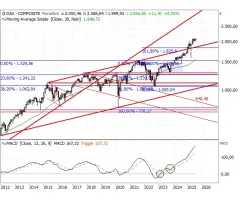
Tagesspanne
2.129,66 – 2.147,20 Pkt.
52W-Spanne
1.863,83 – 2.184,01 Pkt.
Vortag
2.130,67 Pkt.
Eröffnung
2.130,66 Pkt.
Gewinner und Verlierer im CDAX
Top-Aktien im CDAX
| Wert | akt. Kurs | Perf. | Intraday | Einstellungen |
|---|---|---|---|---|
TC Unterhaltungselektr. WKN 745420 | 0,110 EUR | +15,79 % | ||
Pearl Gold WKN A0AFGF | 0,410 EUR | +13,89 % | ||
MATERNUS-Kliniken WKN 604400 | 0,920 EUR | +13,58 % | ||
OHB WKN 593612 | 438,50 EUR | +8,54 % | ||
SFC Energy WKN 756857 | 22,15 EUR | +7,79 % |
Flop-Aktien im CDAX
| Wert | akt. Kurs | Perf. | Intraday | Einstellungen |
|---|---|---|---|---|
Compleo Charging Solutions WKN A2QDNX | 0,016 EUR | -69,31 % | ||
Aeronics Neura System WKN A1R1C8 | 3,000 EUR | -43,93 % | ||
tiscon WKN A40973 | 1,000 EUR | -16,67 % | ||
Branicks Group (ehem: DIC Asset) WKN A1X3XX | 0,800 EUR | -12,85 % | ||
DEMIRE Deutsche Mittelstand Real Estate WKN A0XFSF | 0,376 EUR | -7,39 % |
CDAX im Vergleich
News zu CDAX
CDAX® - Ein zweischneidiges Schwert · Uhr · HSBC
CDAX® - Schlüsselhaltezone bestätigt · Uhr · HSBC
CDAX® - Lehrbuchmäßige Orientierungshilfe · Uhr · HSBC
CDAX® - DAX® erstmals über 18.400 Punkten … · Uhr · HSBC
Technische Analysen
von
DAX-Gap bei 24.738 Punkten noch offen · Uhr · ING Markets

Friedensdeal im Mittleren Osten · Uhr · ING Markets
Anlagethemen
Aktuelle Videos: Livestreams und Analysen
Märkte heute
Redcare hebt an, Amazon baut, Western Digital aufwärts · Uhr · onvista